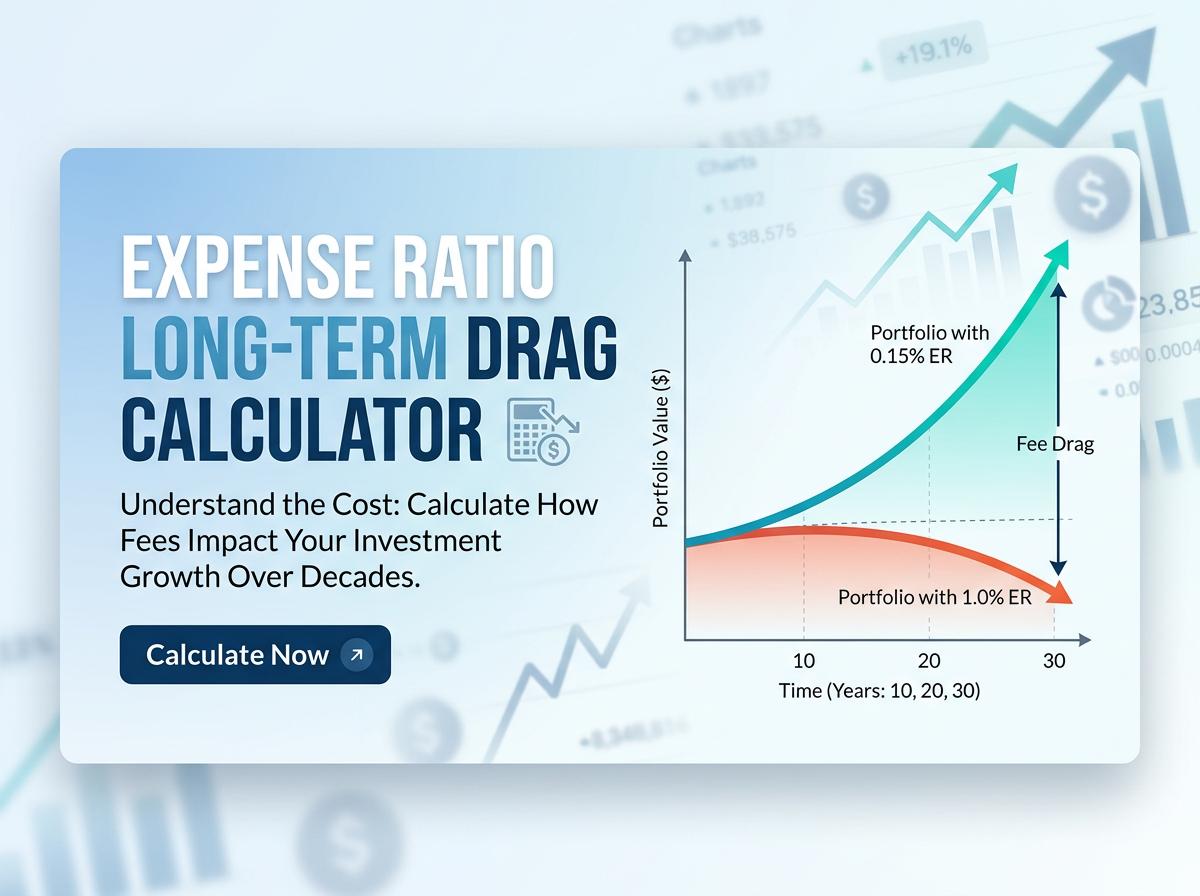

Maximize your investment returns with our free Expense Ratio Long-Term Drag Calculator. Discover exactly how compounding mutual fund and ETF fees eat into your portfolio's growth over decades. Calculate your lost earnings instantly and make smarter, cost-effective investing decisions to keep more of your hard-earned wealth.
Expense Ratio Drag Calculator
Projected Value (No Fees):
Projected Value (After Fees):
Total Lost to Fees:
Portfolio Lost (%):
What is an expense ratio?
An expense ratio is the annual fee that mutual funds, exchange-traded funds (ETFs), and other investment funds charge their shareholders to cover operating costs. It is expressed as a percentage of your total investment in the fund.
- Management Fees: Costs to pay the portfolio managers and researchers.
- Administrative Costs: Recordkeeping, customer service, and legal fees.
- 12b-1 Fees: Marketing, advertising, and distribution expenses.
For example, if you invest $10,000 in a fund with a 1% expense ratio, you will pay $100 annually in fees. These fees are automatically deducted from the fund's total assets on a regular basis, which directly reduces the overall return provided to investors.
How do expense ratios drag down long-term returns?
Expense ratios drag down long-term returns by directly reducing the gross performance of your investment. Because the fee is charged annually based on your total asset value, it acts as a persistent headwind against portfolio growth.
When fees are deducted, you lose not only the money paid but also the future growth that money would have generated. Over time, even seemingly small differences in expense ratios create a massive disparity in final wealth.
- A 7% gross return becomes a 6% net return with a 1.00% fee.
- A 7% gross return becomes a 6.90% net return with a 0.10% fee.
This steady erosion means the fund manager captures a significant portion of your investment gains, drastically reducing the total capital you retain.
How does compounding magnify the impact of investment fees?
Compounding works by generating earnings on both your original principal and your accumulated past earnings. However, this mathematical phenomenon works in reverse when it comes to investment fees.
When an expense ratio deducts money from your account, you lose that capital permanently. Consequently, you also lose all the future compounding growth that the deducted money would have earned over the next 10, 20, or 30 years.
- Year 1: A fee removes a small fraction of your portfolio balance.
- Year 10: The money taken in Year 1 missed a decade of growth; plus, new fees are taken on a larger balance.
- Year 30: The cumulative effect results in an exponentially expanding "wealth gap" between a low-fee and high-fee portfolio.
How much wealth can a one percent fee consume over decades?
A 1% fee sounds negligible, but over several decades, it can consume a staggering amount of your potential wealth due to the loss of compounding interest. Over a 30-year investing horizon, a 1% annual fee can easily devour 20% to 25% of your final portfolio value.
Consider an initial investment of $100,000 earning a 7% annual gross return over 30 years:
| Expense Ratio | Final Portfolio Value | Wealth Lost to Fees |
|---|---|---|
| 0.00% | $761,225 | $0 |
| 0.25% | $708,822 | $52,403 |
| 1.00% | $574,349 | $186,876 |
In this scenario, a 1% fee destroys over $186,000, wiping out nearly a quarter of the investor's potential wealth.
What is considered a good or low expense ratio?
What qualifies as a "good" expense ratio depends heavily on the type of investment fund. However, industry average costs have plummeted, making it easier to find ultra-low-cost options.
- Excellent / Very Low:
0.00% to 0.10%. Typical for broad-market index funds and passive ETFs. Some brokerages even offer zero-fee funds. - Good / Fair:
0.11% to 0.50%. Common for specialized ETFs, target-date funds, or highly efficient active funds. - High / Expensive:
0.51% to 1.00%+. Usually seen in actively managed mutual funds, international funds, or niche sector funds.
For a standard retirement portfolio, investors should ideally aim for an average expense ratio below 0.20% to maximize long-term wealth retention.
How do index fund fees compare to actively managed funds?
Index funds almost universally feature significantly lower expense ratios than actively managed funds. This difference stems directly from how each fund operates.
| Fund Type | Investment Strategy | Average Expense Ratio |
|---|---|---|
| Index Funds | Passively track a benchmark index (e.g., S&P 500) via algorithms. | 0.05% - 0.20% |
| Actively Managed | Employ human managers and research analysts to pick stocks. | 0.50% - 1.00%+ |
Because actively managed funds have higher overhead costs—paying for analysts, software, and frequent trading commissions—they pass these costs onto investors. Index funds require minimal human intervention, allowing for dirt-cheap fees.
Do higher expense ratios lead to better fund performance?
No, higher expense ratios do not lead to better fund performance. In fact, empirical data consistently shows the exact opposite: low-cost funds tend to outperform high-cost funds over the long term.
While paying more for a physical product usually nets you higher quality, investing works differently. High fees create a larger mathematical hurdle that the fund manager must clear just to break even with the market.
- The vast majority (often 80-90%) of expensive, actively managed funds fail to beat their benchmark indexes over 10- and 15-year periods.
- Morningstar studies have shown that the most reliable predictor of future fund returns is a low expense ratio.
How and when are expense ratio fees actually deducted?
You will never receive a physical bill for an expense ratio, nor will you see a specific line-item deduction on your monthly brokerage statement. Instead, the fee is handled internally by the fund company.
- Daily Calculation: The annual expense ratio is divided by the number of days in the year.
- Daily Deduction: This tiny fractional percentage is deducted directly from the fund’s total assets every single day.
- Impact on NAV: The fund's Net Asset Value (NAV)—the daily price per share—is automatically reduced by this daily fee amount.
Because the fee is seamlessly integrated into the share price, your investment returns are reported strictly on a "net" basis. The performance numbers you see already have the fees subtracted.
Where can investors find a specific fund's expense ratio?
Finding a fund's expense ratio is straightforward, as financial regulations require strict transparency regarding investment fees. You can locate this information in several places:
- The Fund Prospectus: This official legal document details the fund’s operations and includes a standardized "Fees and Expenses" table.
- Brokerage Platforms: When researching a ticker symbol on platforms like Vanguard, Fidelity, or Schwab, the expense ratio is prominently highlighted on the main summary page.
- Financial Data Websites: Third-party research portals such as Morningstar, Yahoo Finance, or ETF.com clearly display the expense ratio under the fund's profile.
Always look for the "Net Expense Ratio," as this reflects the actual amount you will be charged after any temporary fee waivers are applied.
How can you minimize expense ratio drag in your portfolio?
Minimizing expense ratio drag requires intentional fund selection and regular portfolio auditing. Here are the most effective strategies to keep your costs low:
- Favor Passive Index Funds: Build your core portfolio using broad-market index funds or ETFs, which inherently feature ultra-low fees.
- Audit Your 401(k): Workplace retirement plans often have limited choices. Review your plan's options and allocate money to the lowest-cost institutional index funds available.
- Avoid Unnecessary Active Management: Unless a specific niche asset class warrants an active manager, skip funds that charge over 0.50%.
- Watch for "Closet Indexers": Avoid expensive active funds that essentially just mimic the S&P 500 but charge active fees.
- Consolidate Accounts: Move money out of legacy mutual funds into modern, low-cost brokerage accounts.
 Portfolio Rebalancing Tax Drag Calculator