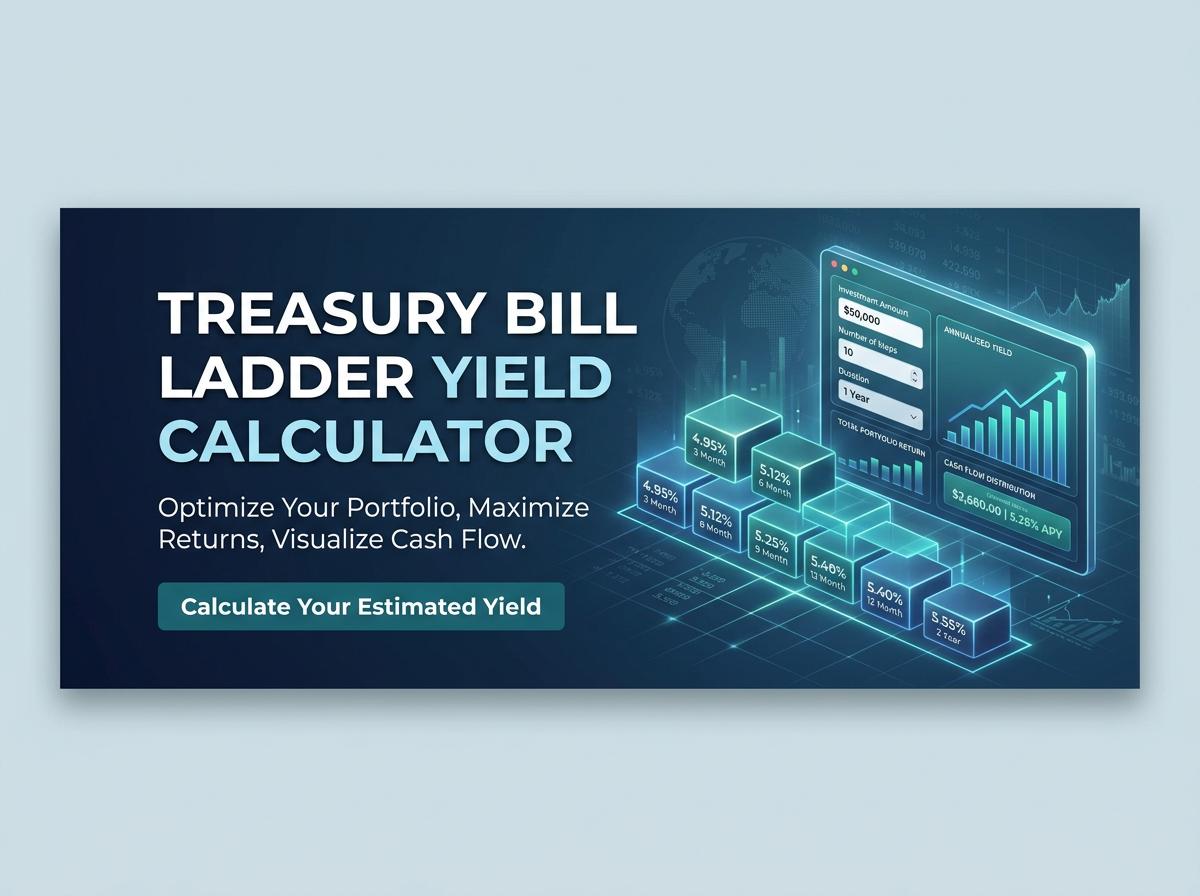

Maximize your investment returns with our Treasury Bill Ladder Yield Calculator. Easily calculate blended yields, project interest earnings, and track maturity schedules for your rolling T-bill strategy. Optimize your risk-free fixed-income investments and manage your cash flow effortlessly. Plan your portfolio today!
Treasury Bill Ladder Yield Calculator
Ladder Rungs
How is the overall average yield of a Treasury bill ladder calculated?
The overall average yield of a Treasury bill ladder is typically calculated using a weighted average of the individual bills' yields.
- Identify the yield of each individual T-bill currently in the ladder.
- Determine the weight of each bill by dividing its face value by the total value of the ladder.
- Multiply each yield by its corresponding weight.
- Sum the results to find the overall blended yield.
If you invest an equal amount of capital into each "rung" (maturity date) of the ladder, you can simply calculate the arithmetic mean. You do this by adding all the current yields together and dividing by the total number of T-bills in your portfolio.
What is the difference between the discount yield and the investment yield?
Treasury bills are sold at a discount to their face value. The difference between the two main yield calculations comes down to the base price and the days in a year:
- Discount Yield: Calculates the return based on the face value of the bill and assumes a 360-day financial year. It often understates the true return of the asset.
- Investment Yield (Coupon Equivalent): Calculates the return based on the actual purchase price (the discounted amount) and assumes a standard 365-day (or 366-day) year.
The investment yield is always slightly higher than the discount yield. It provides a more accurate reflection of your actual return, making it the proper metric for comparing T-bills to other investments like CDs or bonds.
How do fluctuating federal interest rates affect your laddered yield over time?
Fluctuating federal interest rates directly impact your laddered yield as your existing T-bills mature and are reinvested.
- Rising Rates: When the Federal Reserve raises rates, the short-term T-bills in your ladder mature quickly and are reinvested into new bills offering higher yields. Over time, your overall average yield increases.
- Falling Rates: Conversely, when rates drop, maturing bills must be reinvested at lower yields, gradually decreasing your average return.
A T-bill ladder automatically smooths out these fluctuations. It prevents you from being locked into a low rate for an extended period during rising rate environments, while still capturing trailing higher yields as rates begin to fall.
What impact does reinvestment risk have on future yields within the ladder?
Reinvestment risk is the possibility that when a T-bill in your ladder matures, prevailing interest rates will be lower than when you initially purchased it. This impacts future yields in two main ways:
- Lower Overall Yield: You are forced to buy new ladder rungs at reduced rates, slowly dragging down the blended average yield of your entire portfolio.
- Income Reduction: For investors relying on T-bill returns for fixed income, falling rates mean less cash is generated upon maturity.
However, a ladder strategy inherently mitigates this risk. Because only a fraction of your portfolio matures at any given time, your entire balance is not subjected to a sudden drop in interest rates simultaneously.
How does the shape of the yield curve influence the most profitable ladder setup?
The shape of the Treasury yield curve dictates which maturity lengths offer the best returns, directly influencing how you should structure your ladder:
| Yield Curve Shape | Market Condition | Most Profitable Ladder Setup |
|---|---|---|
| Normal | Long-term rates > Short-term rates | Longer ladders (e.g., 6-12 months) to capture higher premiums. |
| Inverted | Short-term rates > Long-term rates | Shorter ladders (e.g., 4-13 weeks) to maximize yield while remaining liquid. |
| Flat | Similar rates across all maturities | Shorter to medium ladders to maintain liquidity without sacrificing yield. |
Are the yields earned from Treasury bills exempt from state and local taxes?
Yes, the interest (or yield) earned from Treasury bills is generally exempt from both state and local income taxes. This provides a significant tax advantage, especially for investors living in states with high income tax rates, such as California or New York.
However, there are a few important tax rules to remember regarding T-bills:
- Federal Taxes: T-bill yields are fully subject to federal income tax.
- Capital Gains: If you sell a T-bill on the secondary market before it matures for a profit, you may owe capital gains tax on the price appreciation.
- Reporting: The interest is reported on Form 1099-INT and must be declared on your annual federal tax return.
How does rolling over mature bills compound your effective annual yield?
Rolling over mature T-bills increases your effective annual yield through the power of compounding. Because T-bills do not pay regular coupon interest, your return is realized in a lump sum when the bill matures at face value.
When a bill matures, you have two reinvestment options:
- Reinvest Principal Only: You maintain the same ladder size and pocket the interest, resulting in flat, simple interest over time.
- Reinvest Principal + Interest: By using the total payout (original investment plus the earned yield) to purchase the next T-bill, your newly invested capital base is larger.
Continually reinvesting both the principal and the interest means you are earning "interest on your interest," effectively boosting your annualized return.
Does building a longer-term ladder always guarantee a higher overall yield?
No, building a longer-term T-bill ladder does not always guarantee a higher overall yield. The relationship between maturity length and yield depends entirely on the current shape of the Treasury yield curve.
- Normal Yield Curve: In a typical economy, longer-term bills (like 52-week) yield more than short-term bills (like 4-week) to compensate for locking up money longer. Here, a longer ladder yields more.
- Inverted Yield Curve: During times of economic uncertainty or tight monetary policy, short-term T-bills often yield higher rates than longer-term bills. In this scenario, a shorter-term ladder is actually more profitable.
Therefore, ladder length should be dictated by prevailing market conditions rather than an assumption that longer is better.
How does a T-bill ladder yield actively compare to a high-yield savings account?
A T-bill ladder and a High-Yield Savings Account (HYSA) are both highly secure vehicles, but their yields behave differently:
| Feature | T-Bill Ladder | High-Yield Savings Account (HYSA) |
|---|---|---|
| Yield Rate | Often slightly higher, tracking the federal funds rate closely. | Generally lower, as retail banks take a margin cut. |
| Rate Lock | Locks in the yield for the duration of each individual bill. | Variable rate; can drop suddenly at the bank's discretion. |
| Tax Efficiency | Exempt from state and local income taxes. | Fully taxable at federal, state, and local levels. |
While a HYSA offers superior instant liquidity, a T-bill ladder typically provides a more stable, higher, and distinctly tax-advantaged yield.
What happens to your realized yield if you must sell a bill before it matures?
If you must sell a Treasury bill on the secondary market before it matures, your realized yield becomes unpredictable and depends heavily on current interest rates.
Because T-bills are sold at a discount, their market value fluctuates inversely with interest rates:
- If rates have risen: Newly issued T-bills are more attractive. The value of your existing T-bill drops, meaning you may have to sell it at a loss, sharply reducing your realized yield (potentially below zero).
- If rates have fallen: Your older, higher-yielding T-bill becomes highly desirable. You can sell it at a premium, potentially realizing a higher short-term yield than if you had held it to maturity.
Selling early introduces interest rate risk, voiding the guaranteed return.
Sources:
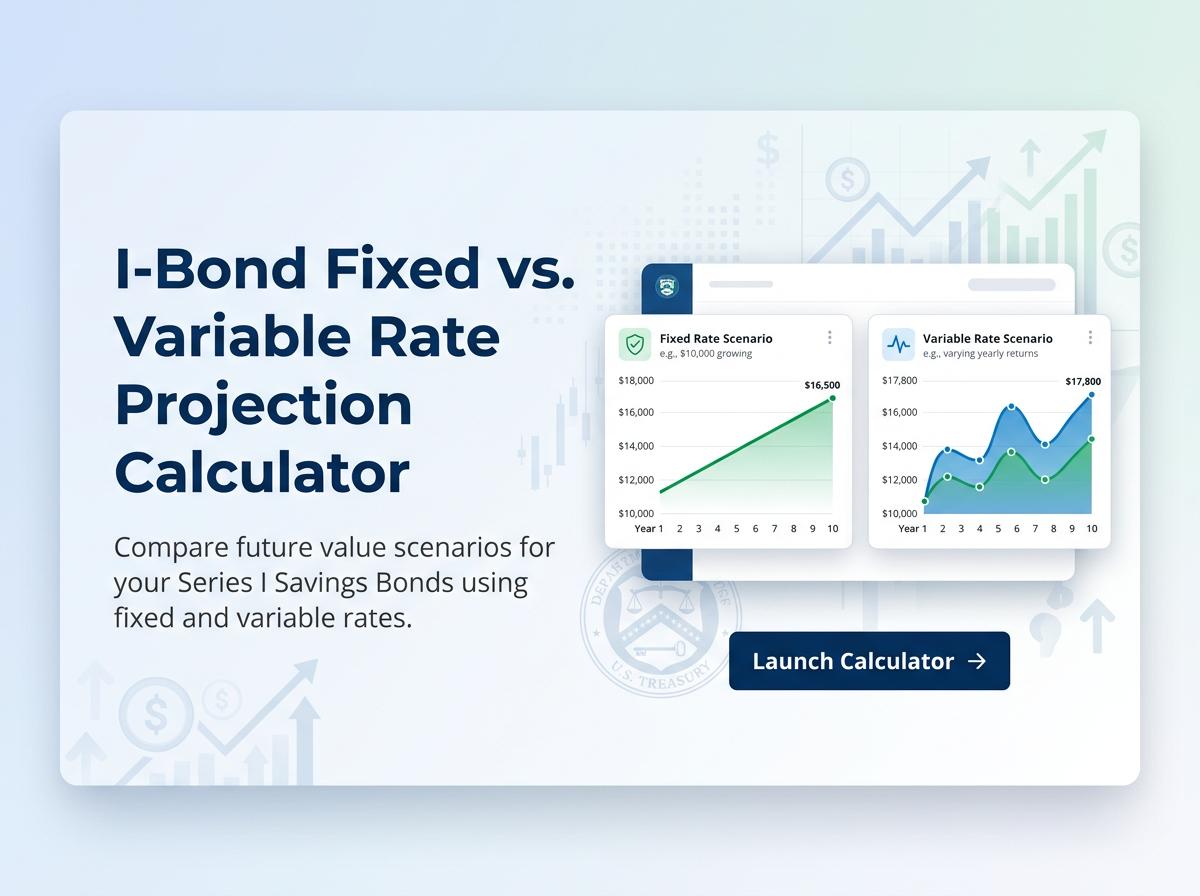 I-Bond Fixed vs. Variable Rate Projection Calculator