
Evaluate real estate investments quickly with our free Cap Rate & Gross Rent Multiplier (GRM) Calculator. Easily analyze property profitability, compare investment opportunities, and make data-driven decisions. Enter property price, rental income, and operating expenses to get instant valuation metrics today!
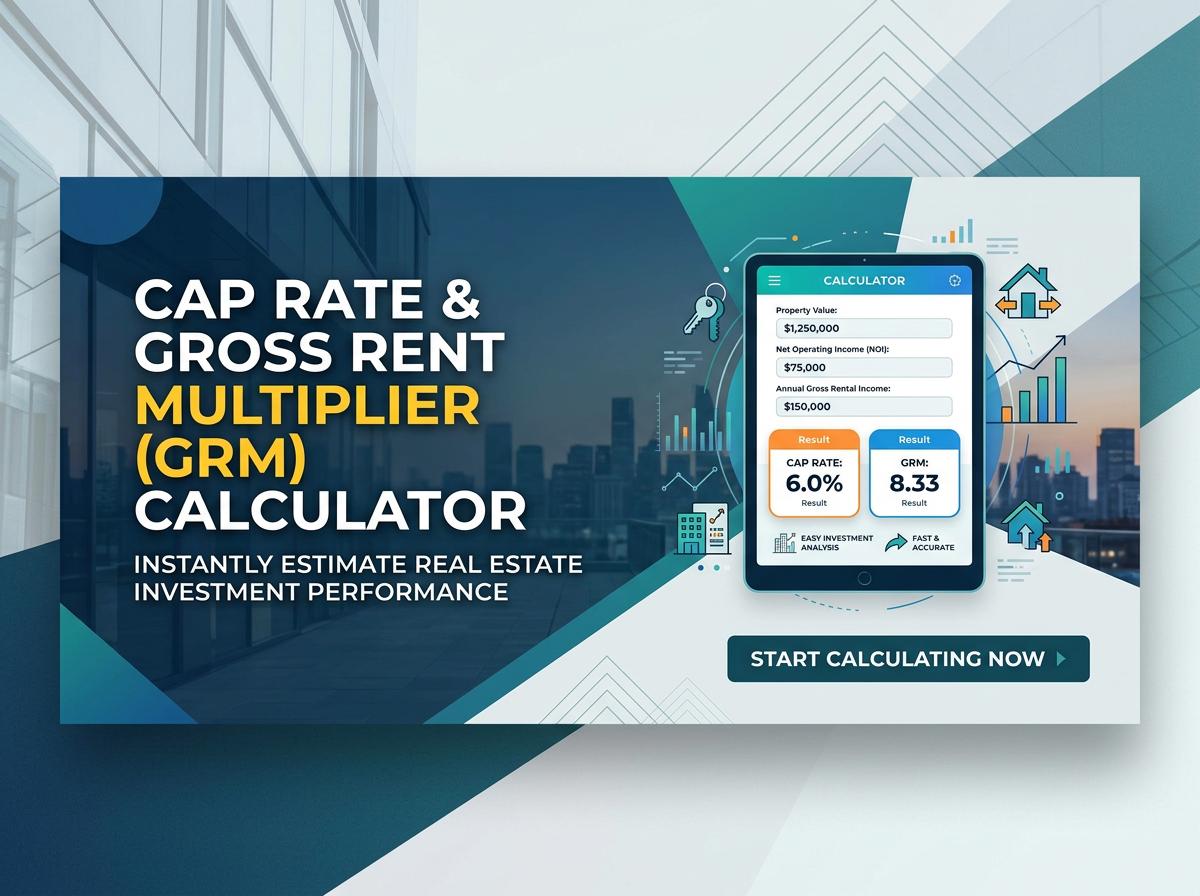
Cap Rate & GRM Calculator
Net Operating Income (NOI):
Cap Rate:
Gross Rent Multiplier (GRM):
What is the basic formula for calculating a capitalization rate?
The capitalization rate (cap rate) is a fundamental metric used in real estate to estimate a property's potential return on investment. The basic formula is:
Cap Rate = (Net Operating Income ÷ Current Market Value) × 100
- Net Operating Income (NOI): The annual income generated by the property minus all operating expenses.
- Current Market Value: The property's current asking price or appraised value.
By calculating this percentage, investors can easily compare the profitability of different properties regardless of their purchase price. For example, a property generating $10,000 in NOI with a value of $100,000 has a cap rate of 10%.
How does Gross Rent Multiplier differ from the cap rate?
The primary difference lies in how these metrics treat property expenses and what the final number actually represents.
| Metric | Income Used | Expenses Factored? | Output Format |
|---|---|---|---|
| Cap Rate | Net Operating Income (NOI) | Yes | Percentage (%) return |
| GRM | Gross Rental Income | No | Ratio (Years to pay off) |
While the cap rate provides a much clearer picture of actual profitability by accounting for operating costs, the Gross Rent Multiplier (GRM) is a quicker, simpler screening tool that only looks at top-line revenue.
What does a higher cap rate indicate about investment risk?
In real estate investing, a higher cap rate generally indicates a higher level of risk associated with the property. The relationship between cap rate and risk typically works like this:
- Higher Cap Rate (e.g., 8-10%+): Often points to properties in less desirable neighborhoods, older buildings requiring more maintenance, or markets with volatile tenant stability. Investors demand a higher annual yield to compensate for this added risk.
- Lower Cap Rate (e.g., 3-5%): Usually found in highly desirable, stable "Class A" locations. These properties carry lower risk, so investors accept a lower annual return in exchange for asset stability and potential appreciation.
Ultimately, cap rates reflect the risk premium investors require for locking up their capital.
Why does the GRM formula ignore property operating expenses?
The Gross Rent Multiplier (GRM) intentionally ignores property operating expenses because it is designed to be a rapid, top-level screening tool rather than a comprehensive financial analysis. By focusing solely on gross income and property price, investors can quickly evaluate dozens of properties in a short amount of time.
Additionally, operating expenses can vary wildly depending on the current owner's management style, tax situation, and deferred maintenance choices. Gross rent, however, is largely dictated by local market forces. By ignoring variable expenses, GRM provides a standardized baseline to compare the relative asking prices of different properties in the exact same neighborhood before committing time to deep financial due diligence.
How do you calculate Net Operating Income to find the cap rate?
Calculating Net Operating Income (NOI) requires deducting all day-to-day operating expenses from the property's total revenue. Here is the step-by-step calculation:
- Determine Potential Gross Income: The total rental income if the property were 100% occupied.
- Subtract Vacancy Loss: Deduct the estimated income lost to empty units and non-paying tenants to find the Effective Gross Income.
- Add Other Income: Include revenue from laundry, parking, or vending machines.
- Subtract Operating Expenses: Deduct all costs necessary to run the property, including:
- Property taxes
- Insurance
- Maintenance and repairs
- Property management fees
The resulting figure is your NOI, which you then divide by the property's value to find your cap rate.
What is considered a good Gross Rent Multiplier for an investment?
A "good" Gross Rent Multiplier varies significantly depending on the local real estate market, but generally, a lower GRM is better. A lower number means it will take fewer years for the property's gross income to pay for the property itself.
General benchmarks include:
- Under 7: Considered excellent. The property generates strong rental income relative to its price, often found in high-cash-flow markets.
- 7 to 10: Considered a solid, average GRM in many balanced real estate markets.
- Over 12: Indicates a longer payoff period. This is common in highly appreciating, expensive coastal markets where investors rely on property value growth rather than cash flow.
Always compare a property's GRM to similar properties in the same neighborhood for accurate context.
Why do both of these metrics exclude mortgage and financing costs?
Both Cap Rate and Gross Rent Multiplier exclude mortgage payments, interest, and other financing costs so investors can evaluate the property's inherent performance, independent of how it is purchased.
Every investor has a different financial situation. One might buy a property with 100% cash, while another might use a 20% down payment with a high-interest commercial loan. If financing costs were included in these metrics, the exact same property would show completely different returns for different buyers.
By removing debt service from the equation, cap rate and GRM act as equalizer metrics. They allow investors to make an "apples-to-apples" comparison of the income-generating power of the real estate itself.
How can GRM be used to quickly screen multiple real estate deals?
Because GRM requires only two easily accessible numbers (asking price and gross annual rent), it is the ultimate triage tool for real estate investors. Here is how to use it for rapid screening:
- Establish a Target: Determine the average GRM for your target neighborhood (e.g., a GRM of 8).
- Scan Listings: Divide the asking price of new listings by their projected annual gross rent.
- Filter Instantly: Discard properties with a GRM significantly higher than your target (e.g., a GRM of 14), as they are likely overpriced for their income potential.
- Shortlist: Keep properties that hit or fall below your target GRM.
Once you have a shortlist, you can spend the necessary time calculating NOI and cap rates to verify actual profitability.
When is it better to rely on cap rate rather than GRM?
Investors should rely on the capitalization rate instead of GRM during the later, more serious stages of evaluation. Specifically, cap rate is superior when:
- Conducting Final Due Diligence: Before making an offer, you must know your actual take-home return. GRM cannot provide this because it ignores operating costs.
- Evaluating Older Properties: A building requiring extensive repairs will have high maintenance costs. GRM hides these expenses, but the cap rate will expose the lower profitability.
- Analyzing Commercial Real Estate: Multi-family, office, and retail properties have complex operating expenses (like common area maintenance or elevator servicing). Cap rate accurately captures these intricacies.
In short, use GRM to find the haystack, but use cap rate to find the needle.
How do fluctuations in property market value impact these two ratios?
Property market value has an inverse relationship with cap rates and a direct relationship with GRM. If rents remain constant while property values fluctuate, the metrics shift as follows:
| Market Fluctuation (Constant Rent) | Impact on Cap Rate | Impact on GRM |
|---|---|---|
| Property Value Increases | Decreases (Yield goes down) | Increases (Takes longer to pay off) |
| Property Value Decreases | Increases (Yield goes up) | Decreases (Faster to pay off) |
During a hot real estate market where home prices skyrocket faster than rents, cap rates naturally compress (shrink) and GRMs rise. Conversely, in a buyer's market where asking prices drop, cap rates expand, making properties look more attractive to cash-flow investors.
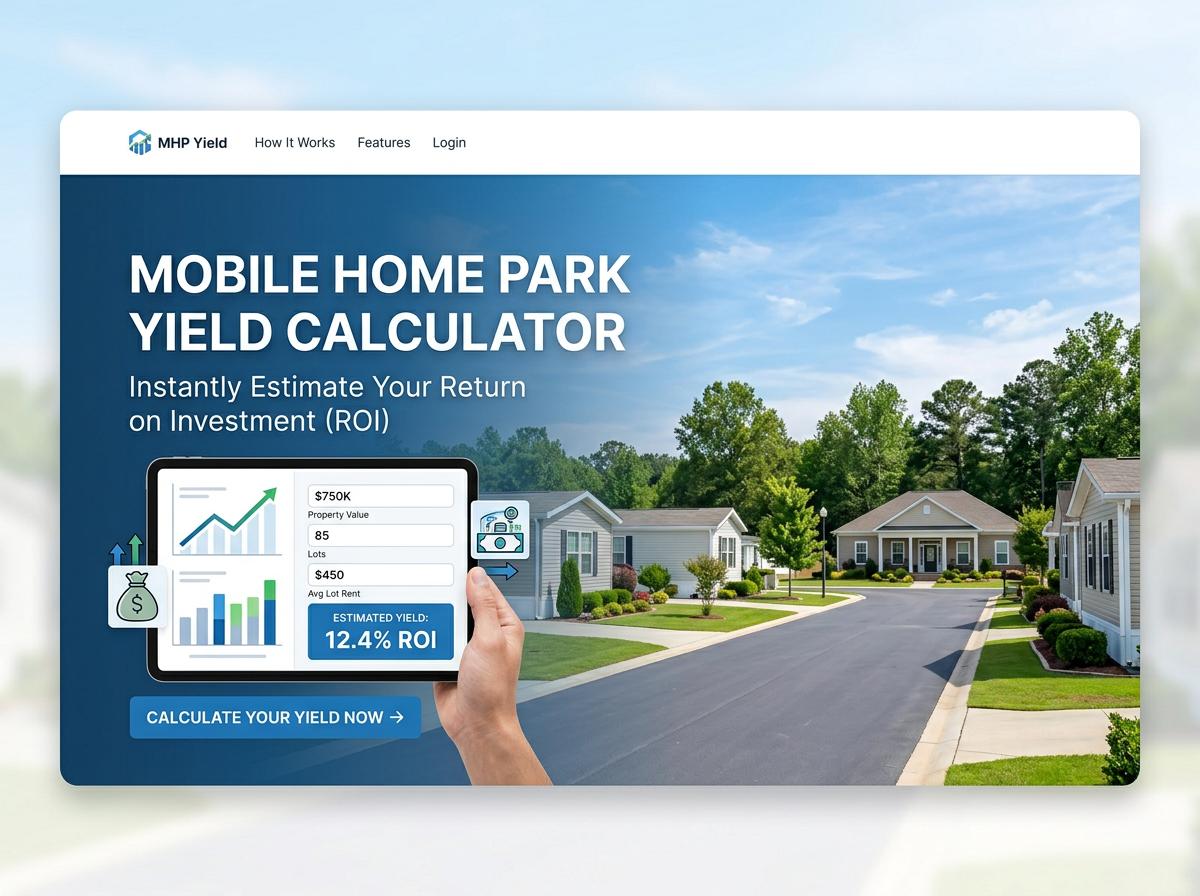 Mobile Home Park Yield Calculator